Solving java.lang.OutOfMemoryError: Metaspace Error
The error java.lang.OutOfMemoryError: Metaspace indicates that you have exhausted an area of the JVM which serves as a registry for your application's Class Metadata. This article is a step-by-step guide to fix Java Metaspace errors with Java 17's elastic metaspace (JEP 387), diagnostic tools like jcmd, and best practices for JVM configuration — including on current Kubernetes/OpenJDK container images.
Problem Description
At runtime, the execution of a Java application triggers the following Exception:
java.lang.OutOfMemoryError: Metaspace
    at java.base/java.lang.ClassLoader.defineClass1(Native Method)
    at java.base/java.lang.ClassLoader.defineClass(ClassLoader.java:1017)
    at java.base/java.lang.ClassLoader.defineClass(ClassLoader.java:879)
A common symptom is that your application is not responsive any more. As a matter of fact, while the JVM might attempt to recover this Error by unloading classes, the application's behavior might become unpredictable due to missing classes or incomplete information in Metaspace.
Cause of the Issue
To understand the cause of a java.lang.OutOfMemoryError: Metaspace let's see where this area is located within the JVM:
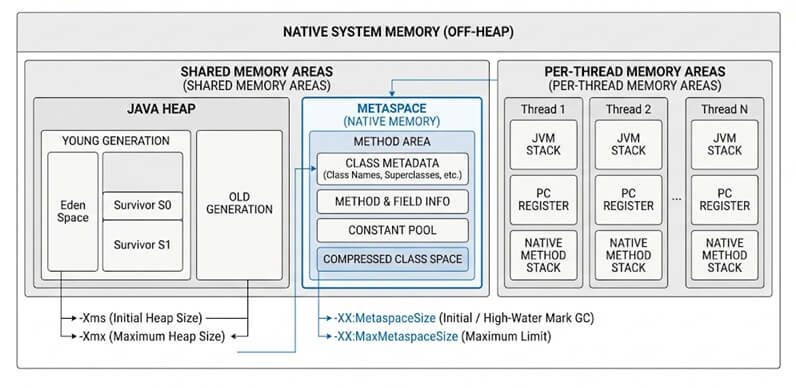
Since the JVM loads classes dynamically during program execution, the Metadata for each class (methods, and other runtime artifacts) are stored in the Metaspace. Unlike the older PermGen, the Metaspace dynamically adjusts its size based on the application's demands and it is garbage-collected by the JVM when the loaded classes are unloaded or become obsolete.
Therefore, the cause of the issue is that you have exhausted the area of memory where the JVM stores the classes' Metadata information.
Solution
Starting with Java 17, the JVM includes Elastic Metaspace (via JEP 387), which more aggressively returns unused metaspace memory to the operating system. This enhancement significantly reduces the risk of running into OutOfMemoryError: Metaspace in many applications, and the benefit carries forward into every LTS release since — Java 21 and the current Java 25 LTS both build on the same elastic metaspace implementation.
Key Recommendations:
- Upgrade to JDK 17 or later — ideally to a current LTS release (Java 21 or Java 25) — to benefit from elastic metaspace and overall improved memory efficiency.
- Remove explicit
-XX:MaxMetaspaceSizeunless absolutely needed. In modern JVMs, it's often no longer necessary and can inadvertently lead to premature OOM conditions.
Monitoring Metaspace Growth
You should monitor the Metaspace to understand if there is a genuine need for a larger Metaspace due to the high number of Metadata your application requires. This can help to determine the -XX:MaxMetaspaceSize for older JDK versions which can still benefit from this setting.
Step 1: Monitor the Metaspace Growth
Firstly, we need to monitor your Java Process. You can do it either from the Command Line or using a Visual Tool.
We will show at first how to monitor your JVM using a tool such as JConsole. Launch jconsole:
jconsoleThen, select your Java process and choose the "Memory" Tab. From the Combo select "Memory pool Metaspace".
The following graph shows an application which initially loaded a high number of classes. However there is no growing trend for this area of Memory:
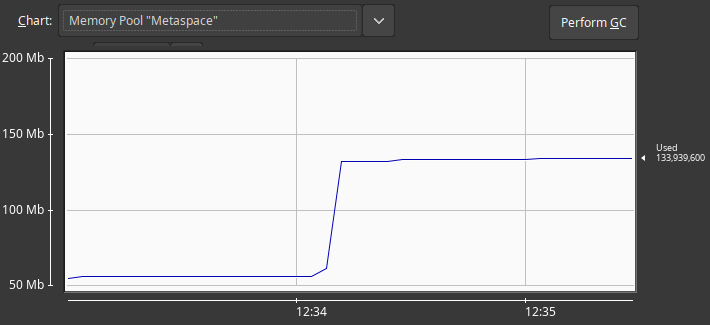
In a scenario where there's an occasional burst of Classloading, you can try increasing the space you need to store Class metadata. In modern Java versions, the amount of native memory that is available for Class metadata is by default unlimited.
Therefore, if you are seeing the java.lang.OutOfMemoryError: Metaspace error you can either increase your current setting for -XX:MaxMetaspaceSize or simply remove it, to use an unlimited setting. Removing it is the best and recommended option in modern JDKs.
For example:
java -XX:MaxMetaspaceSize=256M -XX:MetaspaceSize=128M -XX:MaxMetaspaceFreeRatio=60 YourMainClass-XX:MaxMetaspaceSize=256M: Sets the maximum size of the Metaspace to 256 megabytes.-XX:MetaspaceSize=128M: Sets the initial size of the Metaspace to 128 megabytes.-XX:MaxMetaspaceFreeRatio=60: Sets the maximum Metaspace free ratio to 60%. When the percentage of free space in the metaspace drops below this threshold, the JVM will attempt to free up space by unloading classes that are no longer in use.
Besides the Metaspace capacity, pay attention to the Compressed class space maximum capacity. The CompressedClassSpaceSize is the amount of virtual memory reserved for compressing Class Metadata. Therefore, MaxMetaspaceSize should be larger than CompressedClassSpaceSize.
If MaxMetaspaceSize is set smaller than CompressedClassSpaceSize, the JVM auto-adjusts CompressedClassSpaceSize using this formula:
CompressedClassSpaceSize = MaxMetaspaceSize - 2 * InitialBootClassLoaderMetaspaceSizeFor instance, consider the following settings, resulting in a 768M space for class metadata, with 756M (assuming an initial boot class loader Metaspace size of 6M) allocated for compressed class pointers:
-XX:MetaspaceSize=768M -XX:MaxMetaspaceSize=768M -XX:CompressedClassSpaceSize=1536MOn the other hand, the following scenario shows an evident issue with the amount of memory, which cannot be fully recovered:
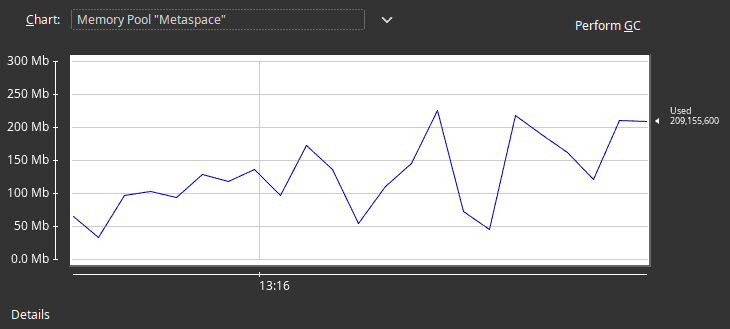
In this scenario you need to continue your analysis by inspecting which Classes are causing an overflow of the Metaspace area.
Monitoring the Metaspace from the Command Line
There are several command line tools that can inspect the JVM Memory. Firstly, determine the PID of your Java application:
jpsThen, from the Command Line, you can monitor the growth of the Metaspace with the jstat tool:
watch jstat -gcmetacapacity <PID>For example, here is a sample output:
MCMN     MCMX      MC        CCSMN   CCSMX     CCSC     YGC   FGC   FGCT    CGC   CGCT
0.0    374784.0  140360.0    0.0   253952.0   21168.0   23     0    0.000    6    0.046
We are mostly interested in the first three columns which are:
- MCMN: Minimum metaspace capacity (kB).
- MCMX: Maximum metaspace capacity (kB).
- MC: Metaspace capacity (kB).
A steady growth of the MC attribute hints to a possible issue or leak with your application code. If this is the case, check "Step 2" to collect further details on your Classes.
Another option to monitor the Metaspace usage is the JVM parameter NativeMemoryTracking, which you can add to the start up parameters. For example:
-XX:+UnlockDiagnosticVMOptions -XX:NativeMemoryTracking=detail -XX:+PrintNMTStatisticsWhen you enable the Native Memory Tracking, you can request a report on the JVM memory usage using the following command:
$ jcmd <pid> VM.native_memoryIf you check the jcmd output, you will find at the bottom the amount of native memory committed in the Internal (committed) section:
Total: reserved=1334532KB, committed=369276KB

-                     Java Heap (reserved=524288KB, committed=132096KB)
                            (mmap: reserved=524288KB, committed=132096KB)

-                     Class (reserved=351761KB, committed=112629KB)
                            (classes #19111)
                            (  instance classes #17977, array classes #1134)
                            (malloc=3601KB #66765)
                            (mmap: reserved=348160KB, committed=109028KB)
                            (  Metadata:   )
                            (    reserved=94208KB, committed=92824KB)
                            (    used=85533KB)
                            (    free=7291KB)
                            (    waste=0KB =0.00%)
                            (  Class space:)
                            (    reserved=253952KB, committed=16204KB)
                            (    used=12643KB)
                            (    free=3561KB)
                            (    waste=0KB =0.00%)
In the line beginning with Metaspace, look for the used value. This is the amount of space the JVM uses for loaded classes. The committed value is the amount of space available for chunks. The reserved value is the amount of space reserved (but not necessarily committed) for metadata.
Step 2: Find the Top Loaded Classes
In order to find which are the top loaded Classes in your JVM, there are several command line and visual tools that can provide clues in your search. Here is a list of the most useful command line tools that you can use:
- Apply the option -verbose:class when starting the JDK:
java -verbose:classThis option logs messages whenever a class is loaded, unloaded, or verified by the JVM class loader.
- Run jmap -clstats:
Find the PID of the Java application and execute the jmap command:
jmap -clstats <PID>This option provides a snapshot of the current state of class loading within your application.
- Run jcmd GC.class_histogram
Find the Java PID and execute the jcmd command passing as argument GC.class_histogram:
jcmd <PID> GC.class_histogram- Acquire a Heap Dump and check top loaded Classes
By taking a Heap Dump of your JVM, you can find even more details such as:
- Dominator tree analysis to identify potential memory leaks.
- Retained size analysis to see which objects are preventing garbage collection.
- Class loading information within the heap context.
If you want to know more about generating a Heap Dump, check this article: How to generate a Heap Dump in Java. In a nutshell, you can use the jmap command line to trigger a Heap Dump:
jmap -dump:format=b,file=dump.hprof <PID>Then, open the Heap Dump with your favourite tool, for example JVisualVM. From the Heap Dump, you can look for duplicate classes, especially those loading your application classes.
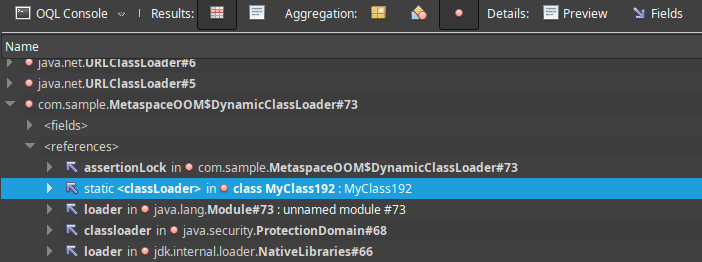
The simplest way to do that is using the OQL console. Within the OQL Console you can execute OQL queries to perform ad hoc analysis on your classes. For example, by executing the following query, you can get a list of classes loaded from each Classloader:
select map(sort(map(heap.objects('java.lang.ClassLoader'), '{loader: it, count: it.classes.elementCount }'), 'lhs.count < rhs.count'), 'toHtml(it) + ""')The following picture shows our findings on a sample Java Application that reproduces the problem (see at the bottom of this article for the reproducer):
In our example, there's a Dynamic ClassLoader that loads new Classes in a loop. By inspecting the references of this ClassLoader we can trace the Class responsible for the issue, which is MyClass:
Additionally, to have more insights on WildFly, you can run this OQL which is specific to JBoss Modules classloaders:
SELECT module.name.value.toString() FROM org.jboss.modules.ModuleClassLoaderBy using the steps in this section, you should be able to detect the root cause of an excessive usage of the Metaspace area.
OutOfMemoryError: Metaspace on Kubernetes/OpenShift
When using the Red Hat build of OpenJDK container images on Kubernetes/OpenShift, the startup script run-java.sh applies its own container-aware defaults, including a default maximum Metaspace of around -XX:MaxMetaspaceSize=100m. You might have noticed that setting this value through the JAVA_OPTIONS environment variable doesn't work as expected, because the image's own default is appended after your value and wins:
VM Arguments: -Xms128m -Xmx1024m -XX:MetaspaceSize=128M -XX:MaxMetaspaceSize=256m -XX:AdaptiveSizePolicyWeight=90 -XX:MaxMetaspaceSize=100m -XX:+ExitOnOutOfMemoryErrorThe correct way to set the MaxMetaspaceSize on these images is through the GC_MAX_METASPACE_SIZE environment variable (and, symmetrically, GC_METASPACE_SIZE for the initial size) — these are the environment variables that run-java.sh itself reads, so they take priority over a raw -XX:MaxMetaspaceSize passed through JAVA_OPTIONS. For example, if you are using a deployment.yaml file to deploy your application (with JKube or a plain Kubernetes manifest), the following settings will override the default values for the initial and maximum Metaspace size:
spec:
  template:
    spec:
      containers:
        - env:
            - name: JAVA_OPTIONS
              value: '-Xms128m -Xmx1024m'
            - name: GC_MAX_METASPACE_SIZE
              value: "256"
            - name: GC_METASPACE_SIZE
              value: "96"
TIP: These container-aware defaults have evolved over time — recent updates to the Red Hat OpenJDK UBI images changed the default maximum heap ratio from 50% to 80% of the container memory limit (controllable via JAVA_MAX_MEM_RATIO), which indirectly affects how much headroom is left for off-heap memory such as Metaspace, thread stacks, and the code cache. If you're tuning Metaspace on a container platform, always check run-java.sh's effective startup log (it prints the final resolved JVM arguments) rather than assuming your environment variables were applied as-is, and consider setting -XX:MaxRAMPercentage/JAVA_MAX_MEM_RATIO deliberately rather than relying on the image's shifting defaults across versions.
Conclusion
In conclusion, resolving the java.lang.OutOfMemoryError related to Metaspace requires a multifaceted approach that involves understanding, monitoring, and optimizing Metaspace usage in Java applications. We have covered this issue from many angles, including the most recent JDK updates and the container-specific quirks you'll run into on Kubernetes/OpenShift.
You can find a reproducer that can simulate the Error on our Website: https://github.com/fmarchioni/mastertheboss/blob/master/scripts/MetaspaceOOM.java
Frequently Asked Questions
What is the default value of -XX:MaxMetaspaceSize?
On a standalone JVM (outside a Red Hat/UBI container image), the default is effectively unlimited — the JVM will grow Metaspace as needed, bounded only by available native memory. On Red Hat's OpenJDK container images, the run-java.sh startup script applies its own default (around 100 MB) unless you override it with GC_MAX_METASPACE_SIZE, which is a common source of confusion for developers moving an app from bare metal into a container.
Should I set -XX:MaxMetaspaceSize at all in 2026?
For most applications on modern JDKs (17+), no — leaving it unset lets Metaspace grow and shrink elastically (JEP 387) based on actual demand. Set an explicit cap only if you have a specific reason to bound native memory usage defensively (for example, to fail fast and restart a pod on a suspected classloader leak) rather than as a routine tuning step.
Why doesn't setting JAVA_OPTIONS override MaxMetaspaceSize on OpenShift?
Because the container image's run-java.sh startup script appends its own -XX:MaxMetaspaceSize default after whatever you pass via JAVA_OPTIONS, so the image's value wins. Use the dedicated GC_MAX_METASPACE_SIZE (and GC_METASPACE_SIZE) environment variables instead, since those are what the startup script itself reads and honors.
What's the difference between Metaspace and PermGen?
PermGen was a fixed-size memory region (pre-Java 8) that stored class metadata and was a frequent source of OutOfMemoryError: PermGen space. Metaspace replaced it starting with Java 8, moving class metadata into native memory that grows dynamically and is garbage-collected, largely eliminating the fixed-size sizing problems PermGen was known for.
Can a classloader leak cause Metaspace OutOfMemoryError even with unlimited MaxMetaspaceSize?
Yes. An unlimited setting removes the artificial JVM-level cap, but Metaspace still consumes real native/off-heap memory. A classloader leak (dynamically generated classes or classloaders that are never released) will keep growing Metaspace until it exhausts available container/host memory, at which point you'll see an OOM at the OS level (or the container getting OOM-killed) rather than a clean OutOfMemoryError: Metaspace from the JVM itself.
How do I find which classes are filling up Metaspace?
Use jcmd <PID> GC.class_histogram or jmap -clstats <PID> for a quick snapshot, or take a full heap dump (jmap -dump:format=b,file=dump.hprof <PID>) and analyze it with a tool like JVisualVM or Eclipse MAT, looking specifically for a growing number of instances of a particular ClassLoader, which is the classic signature of a classloader/Metaspace leak.
Is elastic Metaspace (JEP 387) available in Java 21 and Java 25?
Yes. JEP 387 landed in Java 17 and its improvements to Metaspace memory management continue to apply in every LTS release since, including Java 21 and the current Java 25 LTS — there's no need for a separate flag to enable it.
Recommended Articles
Fix Java.lang.OutOfMemoryError: Compressed Class Space Error on 64-bit Platforms
Learn how to resolve 'java.lang.OutOfMemoryError: Compressed class space error' in Java 1.8 and later versions.
Solve Java.lang.OutOfMemoryError: GC overhead limit exceeded with Eclipse MAT and Heap Dump Analysis
Learn how to fix the 'java.lang.OutOfMemoryError: GC overhead limit exceeded' issue by analyzing heap dumps, identifying memory leaks, and upgrading to a newer JDK version.
Master Java OutOfMemory Error: A Comprehensive Guide for Users and Developers
Learn how to fix Java OutOfMemory errors in applications. Fix as a user or developer. #Java #OutofMemoryError #WildFly #JavaVirtualMachine
Mastering OutOfMemoryError: Direct Buffer Memory in Java - A Comprehensive Guide
Learn how to resolve OutOfMemoryError: Direct buffer memory issues in your Java applications. #Java #WildFly #DirectByteBuffer