How to debug Quarkus applications
Quarkus 3.x enables remote debugging by default on port 5005 during development mode (quarkus:dev). Built on Jakarta EE 10 (jakarta.*) and RESTEasy Reactive with SmallRye Mutiny, Quarkus allows seamless JPDA debugger attachment from IntelliJ IDEA or VS Code. Learn how to debug blocking and reactive non-blocking pipelines, adjust debug suspend settings, and leverage modern IDE tools.
In this article, we will learn how to debug a Quarkus application using two popular Development Environments: IntelliJ IDEA and Visual Studio Code. With the release of Quarkus 3.x—which brings full Jakarta EE 10 migration (moving from javax.* to jakarta.* namespaces) and RESTEasy Reactive as the default web stack—debugging non-blocking Mutiny streams and standard REST resources has become an essential developer skill. We’ll explore how these IDEs can empower you to effectively identify, understand, and resolve issues within your modern Quarkus projects.
Enabling Debugging in Quarkus 3.x
When running in development mode, Quarkus by default configures JVM remote debugging on port 5005. Through this port, Quarkus leverages the JPDA (Java Platform Debugger Architecture) by listening to the socket transport dt_socket, establishing direct communication between your IDE debugger and the underlying JVM.
You can verify that Quarkus debugging is enabled by starting any Quarkus 3.x application in dev mode:
mvn quarkus:devThis is immediately visible in the startup terminal logs:
Listening for transport dt_socket at address: 5005
2024-04-19 09:28:48,151 INFO  [io.qua.dat.dep.dev.DevServicesDatasourceProcessor] (build-8) Dev Services for default datasource (postgresql) started - container ID is a6d792af2bdd
__  ____  __  _____   ___  __ ____  ______
 --/ __ \/ / / / _ | / _ \/ //_/ / / / __/
 -/ /_/ / /_/ / __ |/ , _/ ,< / /_/ /\ \
--\___\_\____/_/ |_/_/|_/_/|_|\____/___/
On top of that, you can verify active socket listeners from the command line using lsof:
lsof -i tcp:5005
COMMAND     PID      USER   FD   TYPE   DEVICE SIZE/OFF NODE NAME
java    2507464 francesco  120u  IPv4 24714318      0t0  TCP localhost:avt-profile-2 (LISTEN)
Customizing Debug Options & Suspend Mode
You can easily customize the debug port or control process startup suspended states using the -Ddebug JVM property:
- Change debug port:
mvn quarkus:dev -Ddebug=6005 - Suspend startup until debugger attaches:
mvn quarkus:dev -Ddebug=client(useful when debugging application boot sequences or CDI extension initialization) - Disable debugging completely:
mvn quarkus:dev -Ddebug=false
Debugging Reactive Endpoints (RESTEasy Reactive & Mutiny)
With Quarkus 3.x, RESTEasy Reactive and SmallRye Mutiny are the primary building blocks for handling web requests. Since requests migrate from javax.ws.rs.* to jakarta.ws.rs.* and execute across Netty event loops or Vert.x worker threads, stepping through reactive code requires a quick understanding of reactive stream breakpoints.
Consider the following Jakarta EE 10 reactive endpoint returning a Mutiny Uni:
package com.mastertheboss.jaxrs;

import io.smallrye.mutiny.Uni;
import jakarta.ws.rs.GET;
import jakarta.ws.rs.Path;
import jakarta.ws.rs.Produces;
import jakarta.ws.rs.core.MediaType;

@Path("/hello")
public class GreetingResource {

    @GET
    @Produces(MediaType.TEXT_PLAIN)
    public Uni<String> hello() {
        return Uni.createFrom().item("Hello Quarkus 3!")
                .onItem().transform(item -> item.toUpperCase()); // Set breakpoint inside lambda
    }
}
When debugging reactive pipelines, place breakpoints inside lambda expressions passed to Mutiny operators (like .onItem().transform(...) or .invoke(...)) rather than on the stream assembly line itself, ensuring your debugger pauses when items flow through the reactive stream on the Vert.x event loop thread.
Debugging from IntelliJ IDEA
The first step in the debug process is setting breakpoints in key sections of your code (such as Jakarta REST endpoints or CDI beans) that you want to inspect:

Then, choose from the IntelliJ Menu: Run | Attach to Process. You will see that IntelliJ reports all running Java applications listening on the socket transport dt_socket:

Alternatively, you can create a permanent Remote JVM Debug run configuration pointing to localhost:5005.
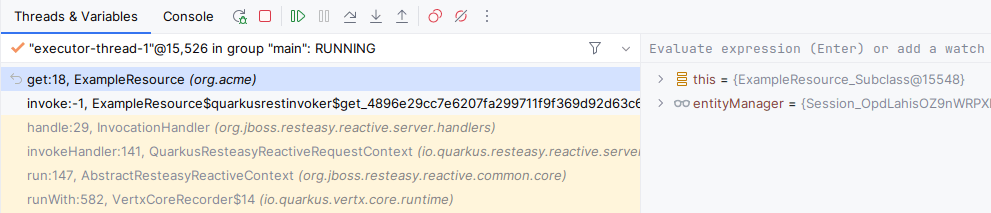
Finally, trigger an HTTP request to your application that hits a breakpoint. IntelliJ IDEA interrupts execution, displays thread call stacks (including Netty event loops for RESTEasy Reactive), and switches seamlessly to Debug mode:
Debugging from Visual Studio Code
In order to debug a Java application from Visual Studio Code, you need to have the Extension Pack for Java installed along with a debug launch configuration. If you are new to using Visual Studio Code with Java, the following cheat-sheet will speed up your learning: Visual Studio for Java CheatSheet.
Once your Java extensions are enabled, create a launch.json configuration. Click on the Run and Debug panel on the left navigation bar, and Visual Studio Code will prompt you to create one:
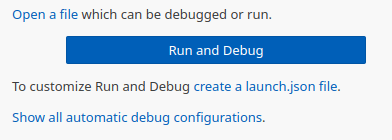
Click on create a launch.json file and select a Java attach configuration. Specify the Quarkus Remote Debug port in launch.json as follows:
{
    "version": "0.2.0",
    "configurations": [
        {
            "type": "java",
            "name": "Quarkus Remote Debug",
            "request": "attach",
            "hostName": "localhost",
            "port": 5005
        }
    ]
}
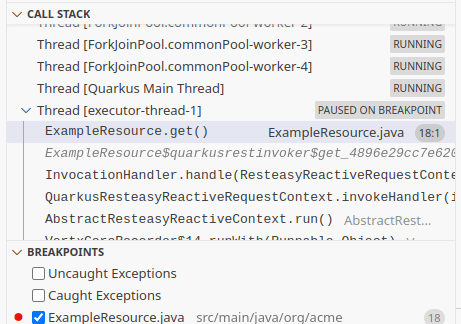
Start mvn quarkus:dev in your integrated terminal, press F5 in VS Code to attach the debugger, and send a request to your endpoints. When your breakpoints hit, the active debug session, variable panel, and thread inspection will start in the Call Stack panel of Visual Studio Code:
Conclusion
Debugging Quarkus 3.x applications with modern IDEs like IntelliJ IDEA and Visual Studio Code offers a fast and effective way to identify and resolve issues during development. By combining Quarkus live-reload capabilities with standard JPDA remote debugging, full Jakarta EE 10 support, and reactive stream inspection in Mutiny and RESTEasy Reactive, developers can streamline their workflow and troubleshoot complex applications efficiently.
Frequently Asked Questions (FAQs)
How do I pause execution at startup to debug Quarkus boot issues?
You can pass -Ddebug=client when launching development mode (e.g., mvn quarkus:dev -Ddebug=client). Quarkus will suspend JVM startup and wait until your IDE attaches to port 5005 before proceeding with application initialisation.
How do I debug non-blocking Mutiny streams in Quarkus 3?
Because Mutiny constructs reactive execution pipelines asynchronously, place your IDE breakpoints inside operator lambdas (such as .onItem().transform(...) or .invoke(...)) rather than on the pipeline declaration. You can also inspect reactive routes and beans using the Quarkus Dev UI available at http://localhost:8080/q/dev.
Did the migration from javax.* to jakarta.* in Quarkus 3 impact debugging?
The JPDA remote debug protocol and port (5005) remain unchanged. However, ensure your IDE breakpoint filters and exception breakpoints are updated to track Jakarta EE classes (such as jakarta.ws.rs.WebApplicationException instead of javax.ws.rs.WebApplicationException).
Recommended Articles
Introduce IntelliJ Quarkus Plugin: Simplify and Productively Develop with Quarkus Technology
Discover how to bootstrap and develop Quarkus projects using JetBrains IntelliJ's Quarkus plugin. Learn about the latest updates, installation process, and features.
A Comprehensive Comparison of WildFly Application Server and Quarkus Framework in Enterprise Java
Explore the features and use cases of WildFly and Quarkus for robust Java applications. #WildFly #Quarkus #EnterpriseJava
Create Standalone Quarkus Applications and Powerful Scripts Using JBang & Quarkus Command Mode
Learn how to develop standalone Quarkus applications with JBang and powerful scripts using Quarkus Command Mode. #Quarkus #Java #Microservices #CloudNative
Configure Default Transaction Timeout in Quarkus - A Comprehensive Guide
Learn how to configure and manage default transaction timeouts in Quarkus applications. #Quarkus #Java #Middleware